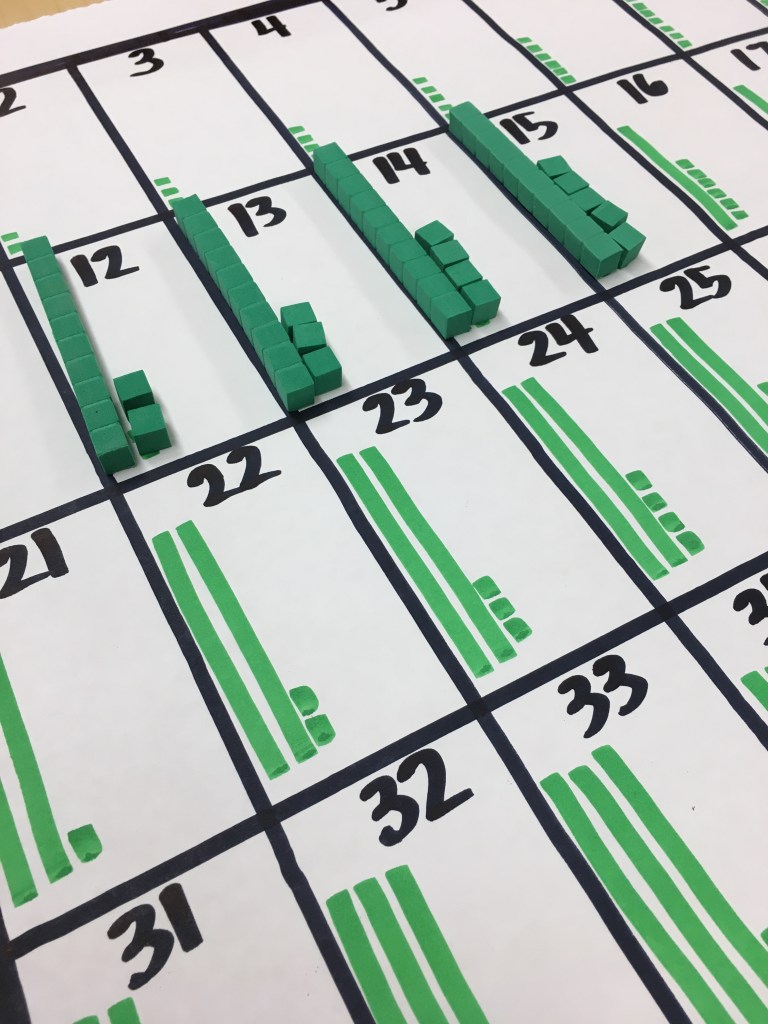
I can’t stop using visuals in elementary math. They are on every anchor chat, every lesson plan, every assignment if possible. It started last year when I noticed students were having trouble understanding place value until I made a visual 100 chart.
When students have a visual to connect mathematics to, it’s like something magical starts to happen. Students who excel want to make their own visuals, students who struggle start to understand…it’s truly remarkable.
You might be wondering more about what I mean by visuals. I’m going to introduce you to Berkeley Everett at Math Visuals. He is a K-5 Math Specialist out in California that has been working on making math come to life with visual animation. It’s truly remarkable the amount of hours he has put into this task, and it’s all FREE.
Need to learn to count in kindergarten? There’s a visual for that.

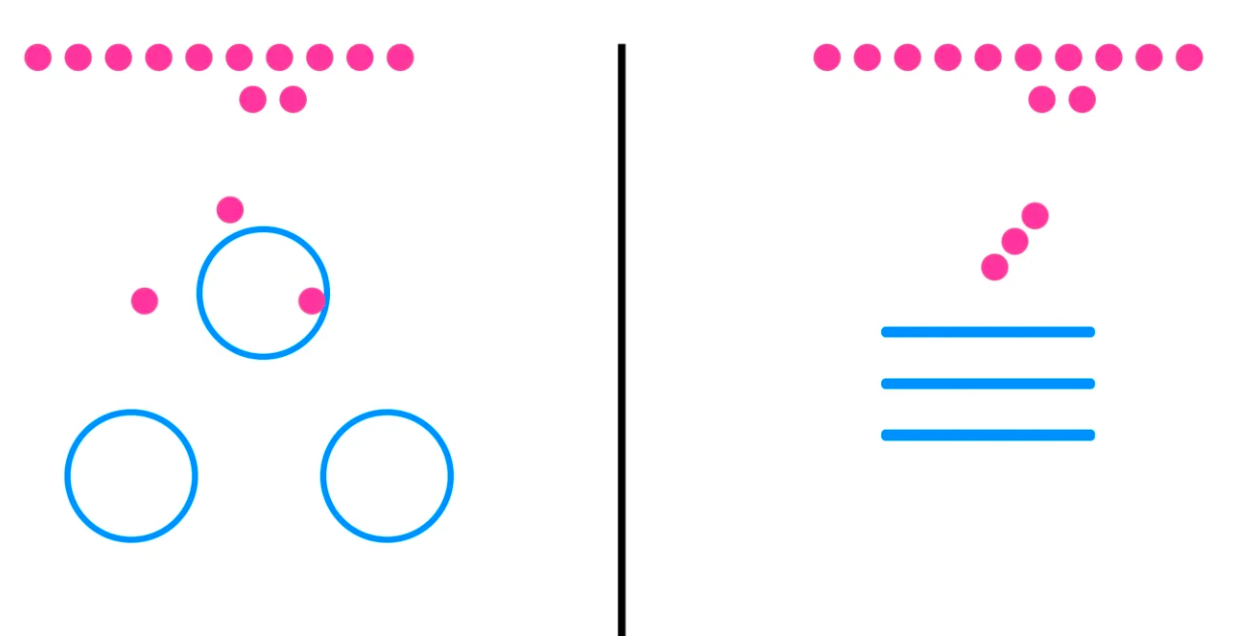
Need to see different types of division? There’s a visual for that.
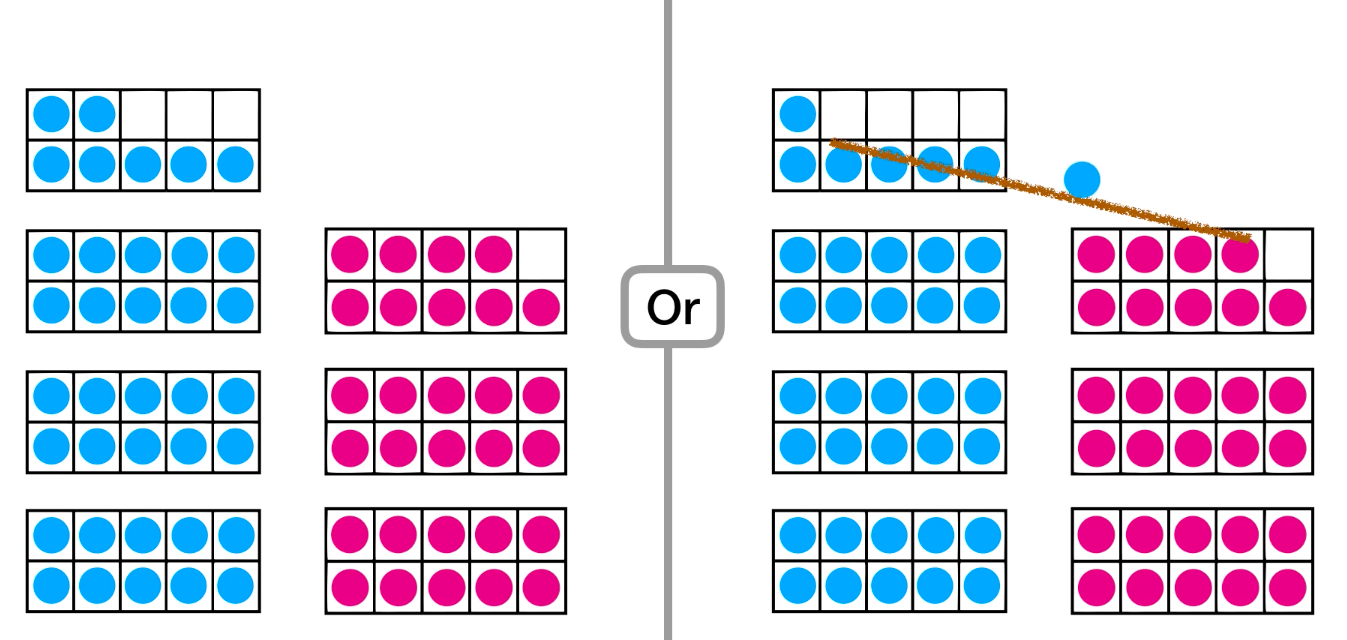
Need to understand the concept behind compensation in addition? There’s a visual for that.
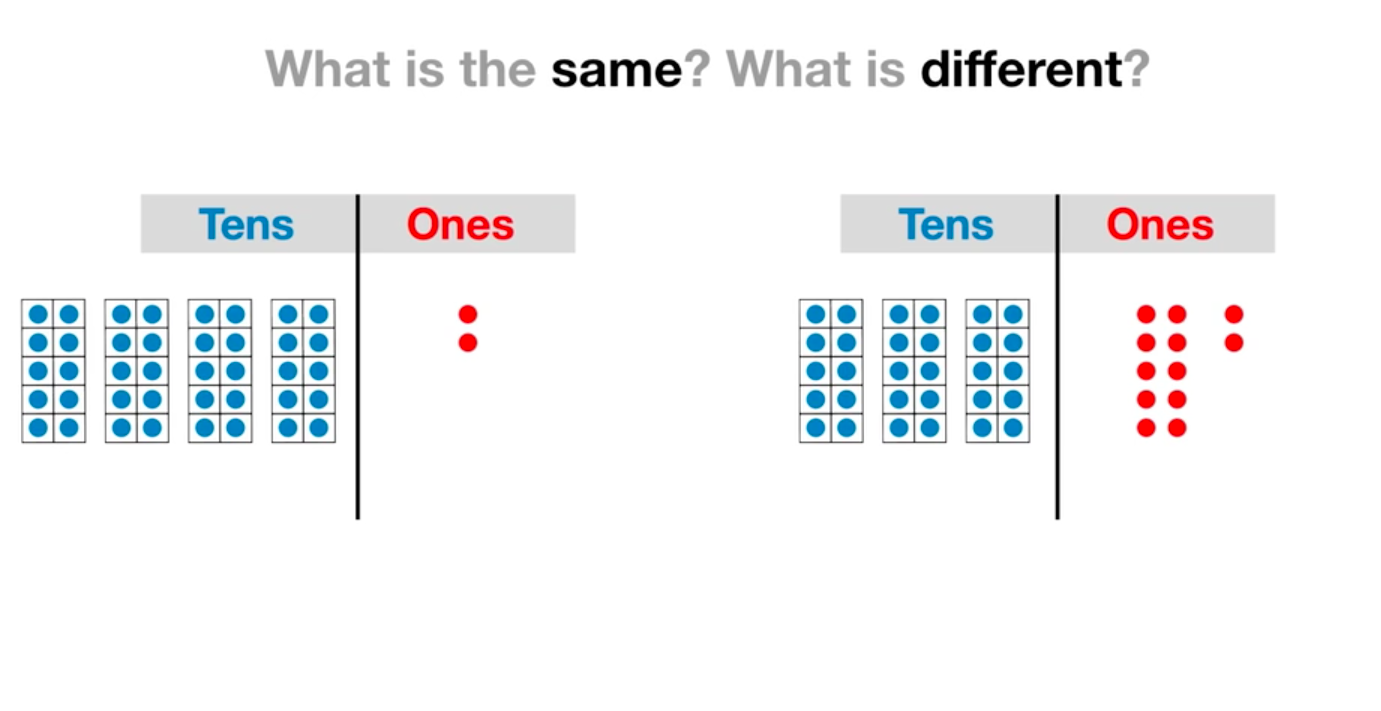
Need to work on different ways to represent two digit numbers using place value concepts? Theres a visual for that, too.
Go to this site and you’ll be lost for hours. Better yet, it will inspire you to create your own visuals on your math anchor charts. It will inspire your students to connect those very abstract math concepts to something that they can hold in their brain.
Thank you Berkeley, you’ve made me a better math teacher, and helped a whole lot of students at our school.

Leave a comment